RPH1 / YER169W Overview
- Standard Name
- RPH1 1
- Systematic Name
- YER169W
- SGD ID
- SGD:S000000971
- Aliases
- KDM4 10
- Feature Type
- ORF , Verified
- Description
- JmjC domain-containing histone demethylase; targets tri- and dimethylated H3K36; associates with actively transcribed regions and promotes elongation; repressor of autophagy-related genes in nutrient-replete conditions; damage-responsive repressor of PHR1; phosphorylated by the Rad53p-dependent DNA damage checkpoint pathway and by a Rim1p-mediated event during starvation; target of stress-induced hormesis; RPH1 has a paralog, GIS1, that arose from the whole genome duplication 1 2 3 4 5 6 7 8 9
- Name Description
- Regulator of PHR1 1
- Paralog
- GIS1 6
- Comparative Info
-







Sequence
The S. cerevisiae Reference Genome sequence is derived from laboratory strain S288C. Download DNA or protein sequence, view genomic context and coordinates. Click "Sequence Details" to view all sequence information for this locus, including that for other strains.
- Summary
- RPH1 has a paralog, GIS1, that arose from the whole genome duplication
Analyze Sequence
S288C only
BLASTN | BLASTP | Design Primers | Restriction Fragment Map | Restriction Fragment Sizes | Six-Frame Translation
S288C vs. other species
BLASTN vs. fungi | BLASTP at NCBI | BLASTP vs. fungi | CGD Synteny Browser
S288C vs. other strains
Protein
Basic sequence-derived (length, molecular weight, isoelectric point) and experimentally-determined (median abundance, median absolute deviation) protein information. Click "Protein Details" for further information about the protein such as half-life, abundance, domains, domains shared with other proteins, protein sequence retrieval for various strains, physico-chemical properties, protein modification sites, and external identifiers for the protein.
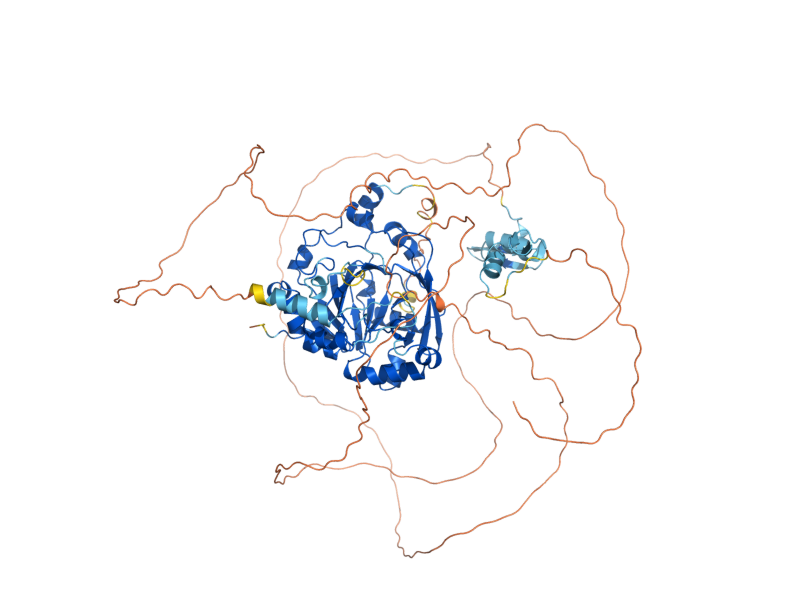
Alleles
Curated mutant alleles for the specified gene, listed alphabetically. Click on the allele name to open the allele page. Click "SGD search" to view all alleles in search results.
View all RPH1 alleles in SGD search
Gene Ontology
GO Annotations consist of four mandatory components: a gene product, a term from one of the three Gene Ontology (GO) controlled vocabularies (Molecular Function, Biological Process, and Cellular Component), a reference, and an evidence code. SGD has manually curated and high-throughput GO Annotations, both derived from the literature, as well as computational, or predicted, annotations. Click "Gene Ontology Details" to view all GO information and evidence for this locus as well as biological processes it shares with other genes.
- Summary
- Histone demethylase specific for K36 tri- and dimethylated histone H3; independently functions as a transcription factor that represses the expression of genes involved in autophagy and DNA repair; involved in transcriptional elongation
View computational annotations
Molecular Function
- Manually Curated
- enables DNA-binding transcription repressor activity, RNA polymerase II-specific (IDA, IMP)
- enables histone H3K36 demethylase activity (IMP, IDA)
- enables histone H3K9 demethylase activity (IDA)
- enables sequence-specific DNA binding (IDA, IMP)
- enables zinc ion binding (RCA)
- High-Throughput
- enables sequence-specific DNA binding (HDA)
Biological Process
- Manually Curated
- involved in negative regulation of autophagy (IMP, IGI)
- involved in negative regulation of transcription by RNA polymerase II (IGI, IMP, IDA)
- involved in positive regulation of transcription elongation by RNA polymerase II (IGI)
Phenotype
Phenotype annotations for a gene are curated single mutant phenotypes that require an observable (e.g., "cell shape"), a qualifier (e.g., "abnormal"), a mutant type (e.g., null), strain background, and a reference. In addition, annotations are classified as classical genetics or high-throughput (e.g., large scale survey, systematic mutation set). Whenever possible, allele information and additional details are provided. Click "Phenotype Details" to view all phenotype annotations and evidence for this locus as well as phenotypes it shares with other genes.
Classical Genetics
- null
- autophagy: increased
- chemical compound accumulation: decreased
- chemical compound accumulation: increased
- chronological lifespan: decreased
- chronological lifespan: increased
- protein/peptide accumulation: increased
- protein/peptide modification: increased
- replicative lifespan: increased
- resistance to chemicals: increased
- RNA accumulation: decreased
- overexpression
- unspecified
- null
- auxotrophy
- chemical compound accumulation: abnormal
- chemical compound accumulation: decreased
- chronological lifespan: decreased
- competitive fitness: decreased
- oxidative stress resistance: increased
- resistance to chemicals: decreased
- respiratory growth: absent
- vegetative growth: decreased rate
- viable
- overexpression
Large-scale Survey
Interaction
Interaction annotations are curated by BioGRID and include physical or genetic interactions observed between at least two genes. An interaction annotation is composed of the interaction type, name of the interactor, assay type (e.g., Two-Hybrid), annotation type (e.g., manual or high-throughput), and a reference, as well as other experimental details. Click "Interaction Details" to view all interaction annotations and evidence for this locus, including an interaction visualization.
Regulation
The number of putative Regulators (genes that regulate it) and Targets (genes it regulates) for the given locus, based on experimental evidence. This evidence includes data generated through high-throughput techniques. Click "Regulation Details" to view all regulation annotations, shared GO enrichment among regulation Targets, and a regulator/target diagram for the locus.
- Summary
- RPH1 encodes a transcription factor that is a member of the C2H2 zinc finger class. Rph1p and its paralog Gis1p act as both transcriptional activators and repressors for overlapping sets of target genes. They act predominantly as repressors during exponential growth. Rph1p and Gis1p repress transcription of PHR1, and this repression is inhibited in response to DNA damage. After the diauxic shift, Rph1p and Gis1p function predominantly as transcriptional activators of genes involved in glycerol and acetate metabolism and in survival during stationary phase. Rph1p binds to stress response elements (STREs) in the promoters of its target genes. In addition to its role as a transcription factor, Rph1p also functions as a histone demethylase, acting on residue K36 of histone H3 during transcription elongation. Rph1p carries the JmjN and JmjC domains characteristic of histone demethylases. GIS1, the paralog of RPH1, encodes a transcription factor whose histone demethylase activity is not confirmed.
Expression
Expression data are derived from records contained in the Gene Expression Omnibus (GEO), and are first log2 transformed and normalized. Referenced datasets may contain one or more condition(s), and as a result there may be a greater number of conditions than datasets represented in a single clickable histogram bar. The histogram division at 0.0 separates the down-regulated (green) conditions and datasets from those that are up-regulated (red). Click "Expression Details" to view all expression annotations and details for this locus, including a visualization of genes that share a similar expression pattern.
All Curated Literature
All manually curated literature for the specified gene, shown as a count of references by year of publication followed by the most recent papers. Click "Literature Details" or "See all" to view all literature information for this locus, organized into topics according to their relevance to the gene (Primary Literature, Additional Literature, or Review).
Loading literature…