NRG1 / YDR043C Overview
- Standard Name
- NRG1 1
- Systematic Name
- YDR043C
- SGD ID
- SGD:S000002450
- Feature Type
- ORF , Verified
- Description
- Transcriptional repressor; recruits the Cyc8p-Tup1p complex to promoters; mediates glucose repression and negatively regulates a variety of processes including filamentous growth and alkaline pH response; activated in stochastic pulses of nuclear localization in response to low glucose 1 2 3 4 5
- Name Description
- Negative Regulator of Glucose-repressed genes 1 2
- Paralog
- NRG2 6
- Comparative Info
-


Sequence
The S. cerevisiae Reference Genome sequence is derived from laboratory strain S288C. Download DNA or protein sequence, view genomic context and coordinates. Click "Sequence Details" to view all sequence information for this locus, including that for other strains.
- Summary
- NRG1/YDR043C is located on the right arm of chromosome IV; coding sequence is 696 nucleotides long with 2 nonsynonymous SNPs
Analyze Sequence
S288C only
BLASTN | BLASTP | Design Primers | Restriction Fragment Map | Restriction Fragment Sizes | Six-Frame Translation
S288C vs. other species
BLASTN vs. fungi | BLASTP at NCBI | BLASTP vs. fungi | CGD Synteny Browser
S288C vs. other strains
Protein
Basic sequence-derived (length, molecular weight, isoelectric point) and experimentally-determined (median abundance, median absolute deviation) protein information. Click "Protein Details" for further information about the protein such as half-life, abundance, domains, domains shared with other proteins, protein sequence retrieval for various strains, physico-chemical properties, protein modification sites, and external identifiers for the protein.
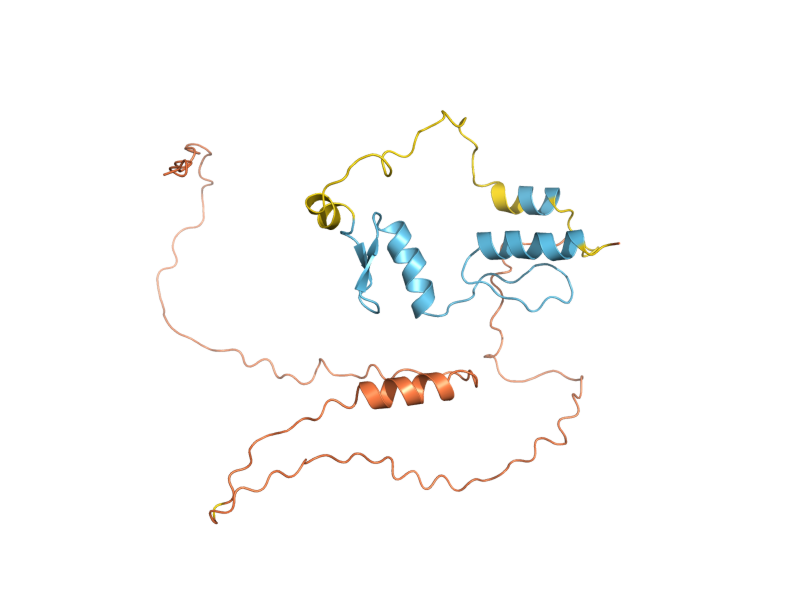
Alleles
Curated mutant alleles for the specified gene, listed alphabetically. Click on the allele name to open the allele page. Click "SGD search" to view all alleles in search results.
View all NRG1 alleles in SGD search
Gene Ontology
GO Annotations consist of four mandatory components: a gene product, a term from one of the three Gene Ontology (GO) controlled vocabularies (Molecular Function, Biological Process, and Cellular Component), a reference, and an evidence code. SGD has manually curated and high-throughput GO Annotations, both derived from the literature, as well as computational, or predicted, annotations. Click "Gene Ontology Details" to view all GO information and evidence for this locus as well as biological processes it shares with other genes.
- Summary
- Sequence-specific DNA binding transcription factor that regulates transcription by RNA polymerase II; involved in regulation of pseudohyphal growth, biofilm formation, hyperosmotic response, and glucose sensing
View computational annotations
Molecular Function
- Manually Curated
Biological Process
- Manually Curated
- involved in cell adhesion involved in single-species biofilm formation (IGI)
- involved in negative regulation of invasive growth in response to glucose limitation (IGI)
- involved in negative regulation of pseudohyphal growth (IGI)
- involved in negative regulation of transcription by RNA polymerase II (IMP, IPI, IGI)
- involved in single-species surface biofilm formation (IMP)
Phenotype
Phenotype annotations for a gene are curated single mutant phenotypes that require an observable (e.g., "cell shape"), a qualifier (e.g., "abnormal"), a mutant type (e.g., null), strain background, and a reference. In addition, annotations are classified as classical genetics or high-throughput (e.g., large scale survey, systematic mutation set). Whenever possible, allele information and additional details are provided. Click "Phenotype Details" to view all phenotype annotations and evidence for this locus as well as phenotypes it shares with other genes.
- Summary
- Non-essential gene in reference strain S288C; null mutants have abnormal vacuolar morphology, are auxotrophic for myo-inositol, sensitive to acids and cations, and are resistant to antifungal miconazole; overexpression slows growth, decreases resistance to TOR inhibitor rapamycin
Classical Genetics
- overexpression
- null
- unspecified
- null
- auxotrophy
- chemical compound accumulation: abnormal
- chemical compound accumulation: increased
- competitive fitness: decreased
- competitive fitness: increased
- metal resistance: increased
- resistance to chemicals: decreased
- resistance to chemicals: increased
- stress resistance: decreased
- toxin resistance: increased
- vacuolar morphology: abnormal
- viable
- overexpression
Large-scale Survey
Interaction
Interaction annotations are curated by BioGRID and include physical or genetic interactions observed between at least two genes. An interaction annotation is composed of the interaction type, name of the interactor, assay type (e.g., Two-Hybrid), annotation type (e.g., manual or high-throughput), and a reference, as well as other experimental details. Click "Interaction Details" to view all interaction annotations and evidence for this locus, including an interaction visualization.
Regulation
The number of putative Regulators (genes that regulate it) and Targets (genes it regulates) for the given locus, based on experimental evidence. This evidence includes data generated through high-throughput techniques. Click "Regulation Details" to view all regulation annotations, shared GO enrichment among regulation Targets, and a regulator/target diagram for the locus.
- Summary
- NRG1 encodes a transcriptional repressor that is a member of the C2H2 zinc finger class. Nrg1p, along with its paralog Nrg2p, responds to glucose signals received via Snf1p kinase, and to stress signals received via the Rim101p transcriptional repressor. Nrg1p and Nrg2p regulate a variety of processes, including response to glucose levels; response to alkaline pH and to salt, osmotic, and oxidative stress; filamentous growth; and biofilm formation. Some major targets of Nrg1p and Nrg2p include FLO11, encoding a cell surface adhesin, ENA1, encoding a plasma membrane salt efflux pump, and SUC2, encoding extracellular invertase. The set of genes regulated by Nrg1p overlaps with, but is not identical to, the set regulated by Nrg2p. Some targets repressed by Nrg1p but apparently not by Nrg2p include RSB1, encoding a lipid translocase that regulates plasma membrane lipid composition, and DIT1, encoding an enzyme required for spore wall maturation. Nrg1p represses transcription by recruiting the Cyc8p-Tup1p complex to promoters. NRG1 expression and Nrg1p activity are regulated on multiple levels. NRG1 transcription is glucose-repressed and is up-regulated at acidic pH, in contrast to NRG2 transcription which does not respond to glucose levels and is up-regulated at alkaline pH. Stability of the NRG1 mRNA is negatively regulated via mRNA decay, and activity of Nrg1p is regulated via phosphorylation by protein kinase CK2 in response to salt, osmotic, and other stresses.
Expression
Expression data are derived from records contained in the Gene Expression Omnibus (GEO), and are first log2 transformed and normalized. Referenced datasets may contain one or more condition(s), and as a result there may be a greater number of conditions than datasets represented in a single clickable histogram bar. The histogram division at 0.0 separates the down-regulated (green) conditions and datasets from those that are up-regulated (red). Click "Expression Details" to view all expression annotations and details for this locus, including a visualization of genes that share a similar expression pattern.
All Curated Literature
All manually curated literature for the specified gene, shown as a count of references by year of publication followed by the most recent papers. Click "Literature Details" or "See all" to view all literature information for this locus, organized into topics according to their relevance to the gene (Primary Literature, Additional Literature, or Review).
Loading literature…