UBI4 / YLL039C Overview
- Standard Name
- UBI4 1
- Systematic Name
- YLL039C
- SGD ID
- SGD:S000003962
- Aliases
- SCD2 12 , UB14 5
- Feature Type
- ORF , Verified
- Description
- Ubiquitin; conjugated to proteins, marking them for selective degradation via the Ub-26S proteasome system; essential for the cellular stress response; encoded as a polyubiquitin precursor with 5 head-to-tail repeats; repeat number is evolutionarily unstable within and between species; 5th repeat has a C-terminal extension and is required for proteostasis, mitophagy, and longevity; regulates SC formation and meiotic recombination; protein abundance increases in response to DNA replication stress 1 2 3 4 5 6 7 8 9 10 11
- Name Description
- Ubiquitin 1
- Comparative Info
-






Sequence
The S. cerevisiae Reference Genome sequence is derived from laboratory strain S288C. Download DNA or protein sequence, view genomic context and coordinates. Click "Sequence Details" to view all sequence information for this locus, including that for other strains.
Analyze Sequence
S288C only
BLASTN | BLASTP | Design Primers | Restriction Fragment Map | Restriction Fragment Sizes | Six-Frame Translation
S288C vs. other species
BLASTN vs. fungi | BLASTP at NCBI | BLASTP vs. fungi | CGD Synteny Browser
S288C vs. other strains
Protein
Basic sequence-derived (length, molecular weight, isoelectric point) and experimentally-determined (median abundance, median absolute deviation) protein information. Click "Protein Details" for further information about the protein such as half-life, abundance, domains, domains shared with other proteins, protein sequence retrieval for various strains, physico-chemical properties, protein modification sites, and external identifiers for the protein.
- Summary
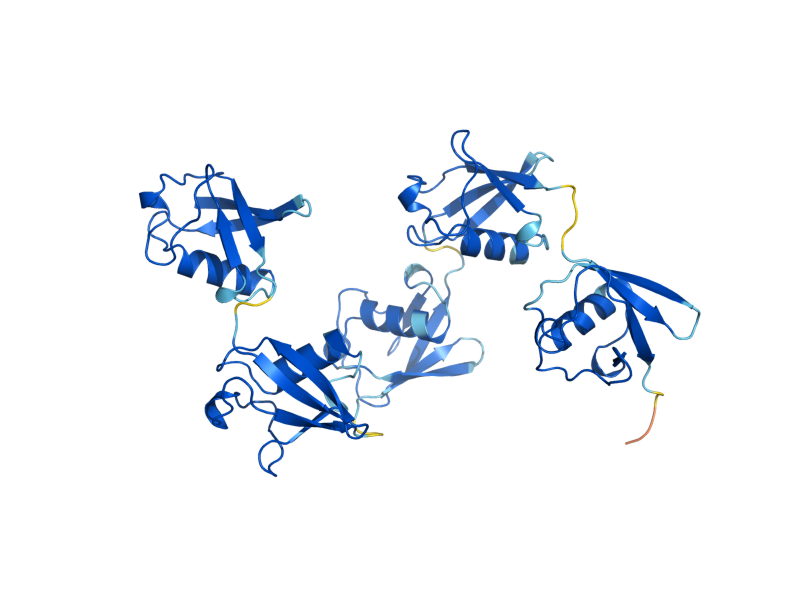
- Ubi4p is 381 amino acids long, low in abundance; contains 5 ubiquitin-like domains in tandem; sumoylated on 6 lysines, phosphorylated on S57; protein abundance increases in response to DNA replication stress
Alleles
Curated mutant alleles for the specified gene, listed alphabetically. Click on the allele name to open the allele page. Click "SGD search" to view all alleles in search results.
View all UBI4 alleles in SGD search
Gene Ontology
GO Annotations consist of four mandatory components: a gene product, a term from one of the three Gene Ontology (GO) controlled vocabularies (Molecular Function, Biological Process, and Cellular Component), a reference, and an evidence code. SGD has manually curated and high-throughput GO Annotations, both derived from the literature, as well as computational, or predicted, annotations. Click "Gene Ontology Details" to view all GO information and evidence for this locus as well as biological processes it shares with other genes.
- Summary
- Ubiquitin, a protein tag covalently attached to proteins to target them to selective degradation by ubiquitin-dependent proteasome-mediated protein catabolic system; localized to the cytoplasm
View computational annotations
Molecular Function
- Manually Curated
- enables protein tag activity (IDA)
Biological Process
- Manually Curated
- involved in protein ubiquitination (IMP)
Cellular Component
- Manually Curated
- located in peroxisome (IDA)
Phenotype
Phenotype annotations for a gene are curated single mutant phenotypes that require an observable (e.g., "cell shape"), a qualifier (e.g., "abnormal"), a mutant type (e.g., null), strain background, and a reference. In addition, annotations are classified as classical genetics or high-throughput (e.g., large scale survey, systematic mutation set). Whenever possible, allele information and additional details are provided. Click "Phenotype Details" to view all phenotype annotations and evidence for this locus as well as phenotypes it shares with other genes.
- Summary
- UBI4/YLL039C is a non-essential gene; null mutant is sensitive to various stressors including: elevated temperature, zinc deficiency, nitrogen starvation, oxidative stress, desiccation, canavanine addition and hydrostatic pressure; null mutant displays decreased spore germination, decreased survival in stationary phase, decreased competitive fitness in various growth media, and is an inositol auxotroph; homozygous diploid null mutant has a sporulation defect
Classical Genetics
- null
- acid pH resistance: decreased
- apoptosis: increased
- chemical compound accumulation: increased
- chronological lifespan: decreased
- desiccation resistance: decreased
- heat sensitivity: increased
- hydrostatic pressure resistance: decreased
- innate thermotolerance: increased
- metal resistance: decreased
- mitophagy: decreased
- protein activity: decreased
- replicative lifespan: decreased
- resistance to chemicals: decreased
- resistance to chemicals: increased
- spore germination: decreased
- starvation resistance: decreased
- survival rate in stationary phase: decreased
- toxin resistance: decreased
- vegetative growth: decreased
- overexpression
- reduction of function
- null
- auxotrophy
- chitin deposition: normal
- chronological lifespan: decreased
- competitive fitness: decreased
- desiccation resistance: decreased
- endocytosis: decreased
- heat sensitivity: decreased
- innate thermotolerance: decreased
- metal resistance: decreased
- oxidative stress resistance: decreased
- peroxisomal transport: decreased
- prion formation: decreased
- protein activity: increased
- redox state: abnormal
- resistance to chemicals: decreased
- resistance to chemicals: increased
- resistance to chemicals: normal
- respiratory growth: absent
- sporulation efficiency: decreased
- sporulation: absent
- stress resistance: decreased
- toxin resistance: increased
- utilization of nitrogen source: decreased rate
- UV resistance: decreased
- vacuolar morphology: abnormal
- viable
Large-scale Survey
Interaction
Interaction annotations are curated by BioGRID and include physical or genetic interactions observed between at least two genes. An interaction annotation is composed of the interaction type, name of the interactor, assay type (e.g., Two-Hybrid), annotation type (e.g., manual or high-throughput), and a reference, as well as other experimental details. Click "Interaction Details" to view all interaction annotations and evidence for this locus, including an interaction visualization.
- Summary
- Ubi4p interacts physically with proteins involved in protein catabolism; UBI4 interacts genetically with genes involved in transcription
1249 total interactions for 724 unique genes
Regulation
The number of putative Regulators (genes that regulate it) and Targets (genes it regulates) for the given locus, based on experimental evidence. This evidence includes data generated through high-throughput techniques. Click "Regulation Details" to view all regulation annotations, shared GO enrichment among regulation Targets, and a regulator/target diagram for the locus.
Expression
Expression data are derived from records contained in the Gene Expression Omnibus (GEO), and are first log2 transformed and normalized. Referenced datasets may contain one or more condition(s), and as a result there may be a greater number of conditions than datasets represented in a single clickable histogram bar. The histogram division at 0.0 separates the down-regulated (green) conditions and datasets from those that are up-regulated (red). Click "Expression Details" to view all expression annotations and details for this locus, including a visualization of genes that share a similar expression pattern.
Summary Paragraph
A summary of the locus, written by SGD Biocurators following a thorough review of the literature. Links to gene names and curated GO terms are included within the Summary Paragraphs.
Last Updated: 2025-05-02
All Curated Literature
All manually curated literature for the specified gene, shown as a count of references by year of publication followed by the most recent papers. Click "Literature Details" or "See all" to view all literature information for this locus, organized into topics according to their relevance to the gene (Primary Literature, Additional Literature, or Review).
Loading literature…