SKO1 / YNL167C Overview
- Standard Name
- SKO1 1
- Systematic Name
- YNL167C
- SGD ID
- SGD:S000005111
- Aliases
- ACR1 7
- Feature Type
- ORF , Verified
- Description
- Basic leucine zipper transcription factor of the ATF/CREB family; forms a complex with Tup1p and Cyc8p to both activate and repress transcription; cytosolic and nuclear protein involved in osmotic and oxidative stress responses 1 2 3 4 5 6
- Name Description
- Suppressor of Kinase Overexpression 1
- Comparative Info
-







Sequence
The S. cerevisiae Reference Genome sequence is derived from laboratory strain S288C. Download DNA or protein sequence, view genomic context and coordinates. Click "Sequence Details" to view all sequence information for this locus, including that for other strains.
Analyze Sequence
S288C only
BLASTN | BLASTP | Design Primers | Restriction Fragment Map | Restriction Fragment Sizes | Six-Frame Translation
S288C vs. other species
BLASTN vs. fungi | BLASTP at NCBI | BLASTP vs. fungi | CGD Synteny Browser
S288C vs. other strains
Protein
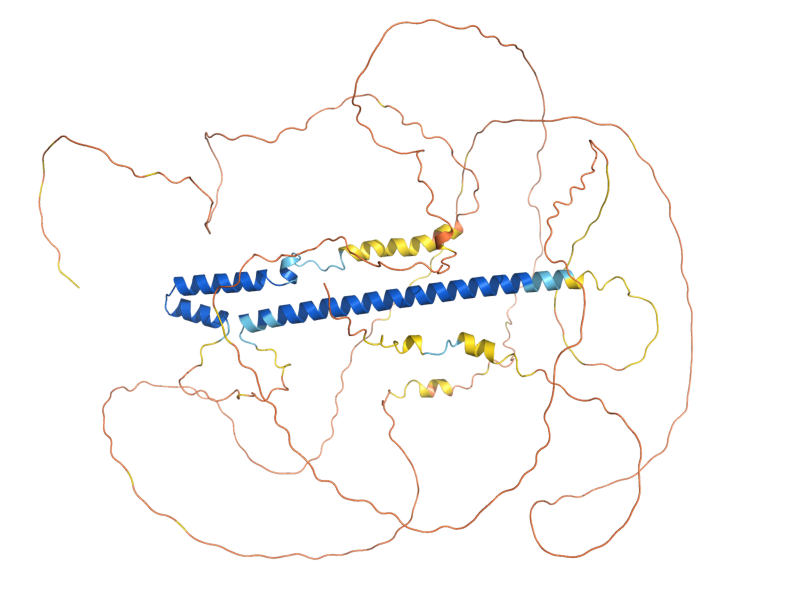
Basic sequence-derived (length, molecular weight, isoelectric point) and experimentally-determined (median abundance, median absolute deviation) protein information. Click "Protein Details" for further information about the protein such as half-life, abundance, domains, domains shared with other proteins, protein sequence retrieval for various strains, physico-chemical properties, protein modification sites, and external identifiers for the protein.
Alleles
Curated mutant alleles for the specified gene, listed alphabetically. Click on the allele name to open the allele page. Click "SGD search" to view all alleles in search results.
View all SKO1 alleles in SGD search
Gene Ontology
GO Annotations consist of four mandatory components: a gene product, a term from one of the three Gene Ontology (GO) controlled vocabularies (Molecular Function, Biological Process, and Cellular Component), a reference, and an evidence code. SGD has manually curated and high-throughput GO Annotations, both derived from the literature, as well as computational, or predicted, annotations. Click "Gene Ontology Details" to view all GO information and evidence for this locus as well as biological processes it shares with other genes.
- Summary
- Cytosolic and nuclear transcription factor involved in response to osmotic stress
View computational annotations
Molecular Function
- Manually Curated
- enables DNA-binding transcription activator activity, RNA polymerase II-specific (IMP, IDA)
- enables DNA-binding transcription factor activity, RNA polymerase II-specific (IMP)
- enables DNA-binding transcription repressor activity, RNA polymerase II-specific (IDA, IMP)
- enables mitogen-activated protein kinase binding (IMP, IDA)
- enables RNA polymerase II cis-regulatory region sequence-specific DNA binding (IDA, IMP)
- enables RNA polymerase II-specific DNA-binding transcription factor binding (IGI, IDA, IMP)
- enables transcription corepressor activity (IMP, IGI)
Biological Process
- Manually Curated
- involved in cellular response to osmotic stress (IMP, IGI, IDA)
- involved in negative regulation of transcription by RNA polymerase II (IGI, IMP)
- involved in positive regulation of transcription by RNA polymerase II (IMP, IGI, IDA)
Phenotype
Phenotype annotations for a gene are curated single mutant phenotypes that require an observable (e.g., "cell shape"), a qualifier (e.g., "abnormal"), a mutant type (e.g., null), strain background, and a reference. In addition, annotations are classified as classical genetics or high-throughput (e.g., large scale survey, systematic mutation set). Whenever possible, allele information and additional details are provided. Click "Phenotype Details" to view all phenotype annotations and evidence for this locus as well as phenotypes it shares with other genes.
Classical Genetics
- null
- chemical compound accumulation: abnormal
- chemical compound accumulation: increased
- chronological lifespan: decreased
- chronological lifespan: increased
- competitive fitness: decreased
- endoplasmic reticulum morphology: abnormal
- haploproficient
- innate thermotolerance: increased
- oxidative stress resistance: decreased
- replicative lifespan: decreased
- resistance to chemicals: decreased
- resistance to chemicals: increased
- vacuolar morphology: abnormal
- vegetative growth: decreased
- viable
- overexpression
Large-scale Survey
Interaction
Interaction annotations are curated by BioGRID and include physical or genetic interactions observed between at least two genes. An interaction annotation is composed of the interaction type, name of the interactor, assay type (e.g., Two-Hybrid), annotation type (e.g., manual or high-throughput), and a reference, as well as other experimental details. Click "Interaction Details" to view all interaction annotations and evidence for this locus, including an interaction visualization.
111 total interactions for 89 unique genes
Regulation
The number of putative Regulators (genes that regulate it) and Targets (genes it regulates) for the given locus, based on experimental evidence. This evidence includes data generated through high-throughput techniques. Click "Regulation Details" to view all regulation annotations, shared GO enrichment among regulation Targets, and a regulator/target diagram for the locus.
- Summary
- SKO1 encodes a transcriptional repressor of the ATF/CREB family, containing a bZIP structural motif which consists of a leucine zipper that mediates dimerization and an adjacent basic region that contacts DNA. Sko1p binds as a homodimer the ATF/CREB consensus sequence TGACGTCA, and represses transcription both by recruiting the Cyc8-Tup1 corepressor and by directly competing with Aca1p and Cst6p for target sites. Sko1p regulates a transcriptional network upon osmotic stress, binding promoters of other transcription factors including MSN2, MOT3, ROX1, MGA1, and GAT2, and also the promoter of the phosphatase encoded by PTP3, a key component of the signal transduction pathway. Sko1p is also important for recruitment of SAGA histone acetylase and SWI/SNF nucleosome-remodeling complexes to osmotic-inducible promoters. Overall, S. cerevisiae contains approximately 40 Sko1p target promoters. ENA1 is a target of Sko1p, and it is responsible for salt regulation via the HOG pathway. Target genes also include SUC2, GRE2, AHP1, SFA1, GLR1, YML131W, and COS8. During hyperosmotic stress, Hog1p MAP kinase associates with target promoters and phosphorylates the amino terminus of Sko1p, disrupting its interaction with the Cyc8-Tup1 corepressor and thus converting Sko1p into a transcriptional activator. Sko1p is localized to the nucleus in unstressed cells, and becomes redistributed to the cytosol upon severe salt stress. Sko1p nuclear localization depends on the stress-inhibited protein kinase A (PKA), which phosphorylates Sko1p near its bZIP domain.
Expression
Expression data are derived from records contained in the Gene Expression Omnibus (GEO), and are first log2 transformed and normalized. Referenced datasets may contain one or more condition(s), and as a result there may be a greater number of conditions than datasets represented in a single clickable histogram bar. The histogram division at 0.0 separates the down-regulated (green) conditions and datasets from those that are up-regulated (red). Click "Expression Details" to view all expression annotations and details for this locus, including a visualization of genes that share a similar expression pattern.
All Curated Literature
All manually curated literature for the specified gene, shown as a count of references by year of publication followed by the most recent papers. Click "Literature Details" or "See all" to view all literature information for this locus, organized into topics according to their relevance to the gene (Primary Literature, Additional Literature, or Review).
Loading literature…